One of my friend asked me whether is it possible in SQL Server 2005/2008 to know how a query is executing, and what time and hits are required by a particular query for execution? These calculations are of so much importance when it comes to real time applications, like in a solution in which too many transactions are happening say, a nuclear power plant system or GPS etc, in such systems we need to make sure that our query is not consuming extra time by encountering some hits which are not required for the execution. Lets say if my client want me to write a query for him which can deliver the very last ID in a particular table or he wants to insert some data in multiple table at once or updating just a field in a table. All of these things can happen in many ways but when it come to accuracy and time consumption we need to go for certain measures.
Now thanks to SQL Server 2005/2008, query execution and analyzing is too very much easy. We can do this using reporting services but lets take a bit more convenient way to find out how a query is behaving and relating with the database to fulfill its cause of execution.
I am using a database here named “Ideal” and I want to see the statistics of a query which is delivering me all the columns of all the records from a table named ‘acount’.
· For that I just opened my SQL Server Management Studio.

· Then I right click on my database and select new query.
· Now SQL Server will ask me for authentication in order to enter in the world of query analyzation.
Now before I right my query I need to press some buttons so that SQL Server provide me a some additional details against my query.
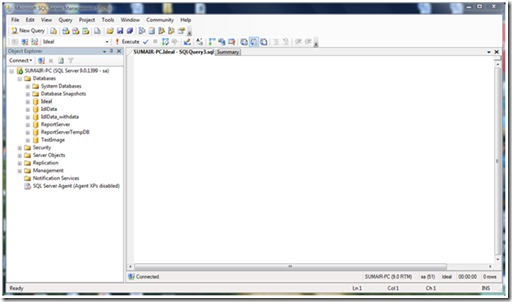
![]()
As in the above picture two buttons are highlighted in my Toolbar.
One can also access these details using “Query” menu in the menu bar.
Query -> Actual Execution Plan
Query -> Client Statistics
Or press [Ctrl+M] for Include Actual Execution Plan and [Shift+Alt+S] for Include Client Statistics. This is it game nearly done.
Now all I need is to right a set of queries in question.
For an example I am selecting all columns of all the records in my acount table using two traditional ways.
First:
select * from acount
and Second:
select [AccountCode], [Name], [Date], [Type], [Transactional], [Debit], [Credit],
[lDebit], [lCredit], [recStatus] from acount
now when you execute it I will receive some additional tabs with the Results and Messages tab named Execution Plan and Client Statistics.
Execution Plan will show me from which state I initiate my query and what happened when the query scanned.
Your Interface with Execution Plan selected will be looking something like this
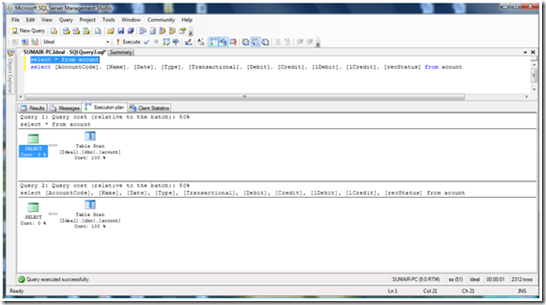
If you hover on any state you will see a table of details
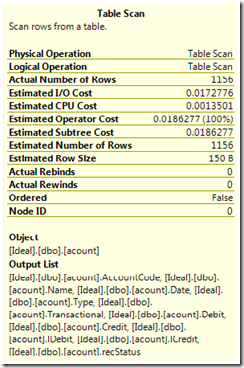
All this regarding details refers to data in transition with my queries. Now the second tab.
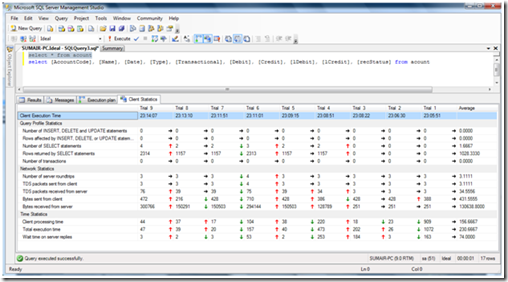
This one will analyze how many types of transitions we are doing with the help of query? Relation with the help of red and green and black arrows for the relevancy among queries. Green representing better then pervious query, red for inaccuracy and black to the identical results.
Main sections in Client statistics tab are:
· Client Execution Time
· Query Profile Statistics
· Network Statistics
· Time Statistics
So, this is what we have on the basics for SQL Query analyzing in SQL Server 2005/2008. Feel free to ask any QUERY you may have. Take care. 🙂