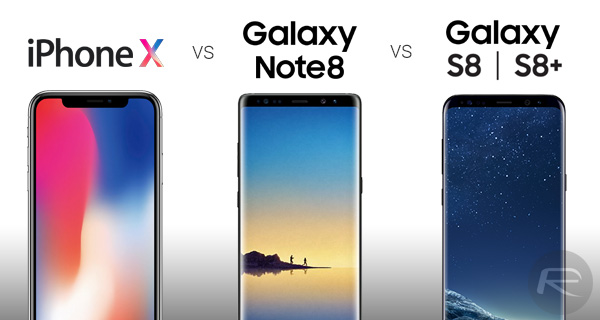
Here’s Apple iPhone X Vs Samsung Galaxy Note 8 Vs Galaxy S8 Vs Galaxy S8+ benchmarks comparison side-by-side.
Now that the iPhone X has been officially introduced by Apple, it’s that time when multiple devices are put through benchmark comparison services to see exactly how they perform against one another.
Of course, all eyes will be on Apple’s new iPhone X to see what it brings to the table, and judging by the results, Apple has once again managed to pull together hardware and software to bring out the best performance in the market. We should all know the score by now. Whenever a new device is pushed into the market, there becomes an immediate requirement to see exactly how that device performs when certain tests are performed.
Geekbench is one of the most popular services and a industry standard used to perform these tests, with a series of tests ran on a device process and timed to see how long each test actually takes to complete. A higher score means a test has been completed quicker than one with a lower score, so, essentially, the higher the score each device returns means it’s performed better.
With the above in mind, you only need to look at the iPhone X single-core and multi-core scores to know how far ahead it’s in terms of hardware performance thanks to Apple in-house designed 6-core A11 Bionic chip.
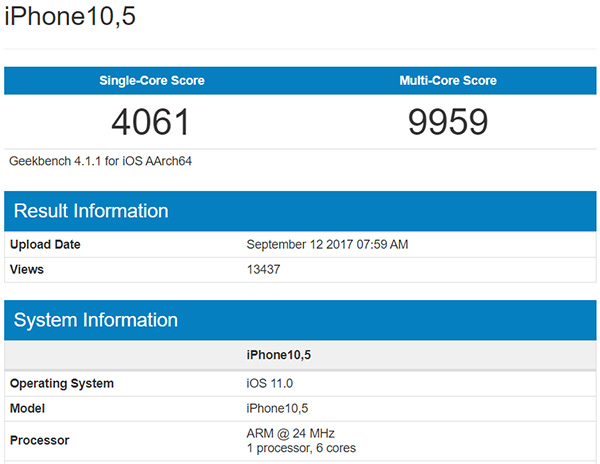
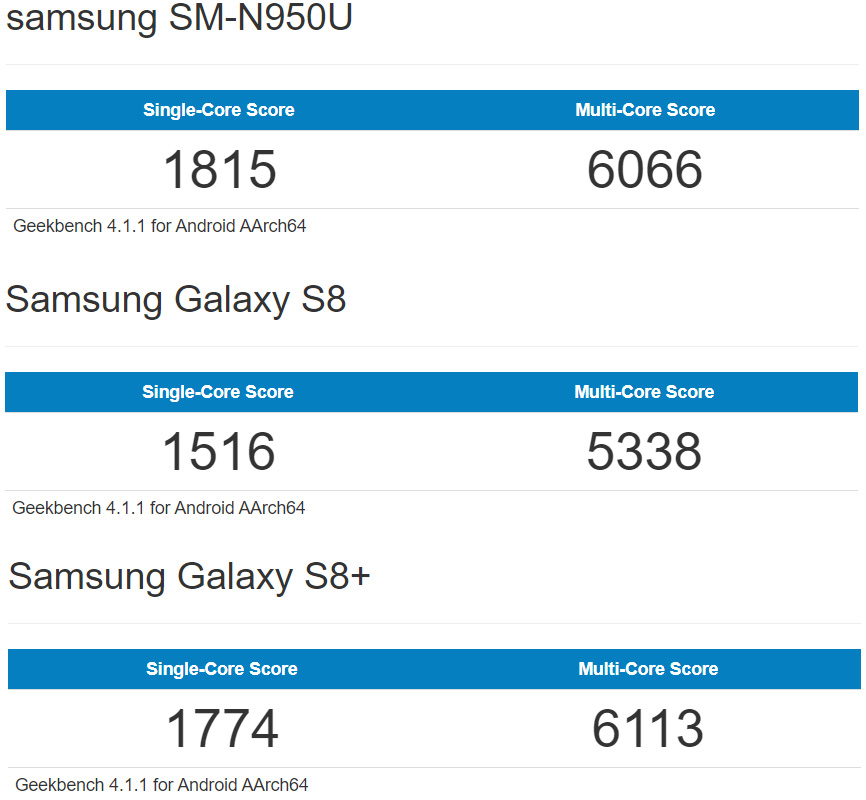
When ran through Geekbench benchmarks, Apple’s iPhone X (denoted by iPhone10,5) returned a single-core score of 4061, with Samsung’s Galaxy Note 8 (denoted by SM-N950U) returning 1815, the S8 coming back with 1516, and the S8+ doing slightly better with a single-core score of 1774.
There’s only really one winner in that respect, with the difference being crazy, but even crazier when you consider that Apple’s latest 2017 13-inch MacBook Pro returned a single-core score of 4162.
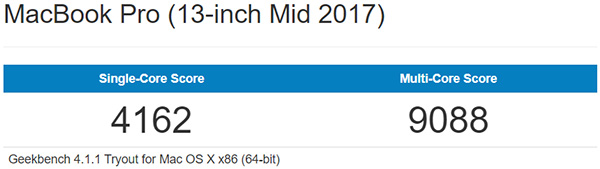
From a multi-core perspective, things aren’t really any different. Samsung’s Note 8, Galaxy S8, and Galaxy S8+ notched up 6066, 5338, and 6113, respectively. Apple’s iPhone X once again sits in a league of its own with a score of 9959. Once again, for comparison, Apple’s latest 2017 MacBook Pro returned a multi-core score of 9088, which means iPhone X actually bested it.
We’ve already had a quick glance at just how well iPhone X performs compared to competition, but it’s always great to see that performance stacked against what will essentially be its competition for the next twelve months.
What’re your thoughts on this? Is this level of performance enough to make you part with $999 for iPhone X? Sound off in the comments below.
You may also like to check out:
- iOS 11 Final GM Release Notes / Changelog: All Changes In One Place
- iPhone X Vs iPhone 8 Vs 8 Plus Vs iPhone 7 Specs Comparison
- iOS 11 Final Version Gets Release Date
- iOS 11 GM Download IPSW Links And OTA Golden Master Update Released
- Download iOS 11 GM & Install On iPhone 7, 7 Plus, 6s, 6, SE, 5s, iPad, iPod [Tutorial]
- Jailbreak iOS 11 On iPhone And iPad [Status Update]
You can follow us on Twitter, add us to your circle on Google+ or like our Facebook page to keep yourself updated on all the latest from Microsoft, Google, Apple and the Web.